Metrics
note
PayString was previously known as PayID.
Deploy a PayString server with Docker, and pull PayString metrics into Prometheus#
In this tutorial, you will deploy a PayString server and run Prometheus locally using Docker, and you will create a configuration file for the PayString server so that PayString metrics are pulled into Prometheus.
Prerequisites#
Install the following software on your machine, if not already present.
Build a Docker container for setting up a PayString server#
Run these commands to build a Docker container for a PayString server.
Create Docker network for PayString#
You will run several containers in Docker that must talk to each other. To set up these containers, create a docker network called paystring-network.
Start a Postgres Database#
To have a PayString server, you require a Postgres database to store PayString accounts and address mappings. To do this, run the postgres database in docker with a default password of password, and tell the database to use the paystring-network that you previously created. Name this docker container paystring-postgres, so that you can reference the container by name when you connect your PayString server. Note that both the default database and the user are named postgres, as described at Postgres Docker Official Images.
Start and test the PayString server#
To start the PayString server, run the PayString server in docker using the image you created. You must also use the docker network paystring-network so that it can connect to the paystring-postgres container.
Test whether the PayString server is running by creating a PayString with this cURL command.
You should get a Created response.
Query the PayString server to make sure it resolves, using this cURL command.
Start Prometheus#
In this step, you will run prometheus in docker and configure it to scrape the PayString server’s metrics. To do this, you need to create a prometheus.yml file on the host machine and mount it in the docker container.
Create a file named prometheus.yml with these contents.
Start the docker container:
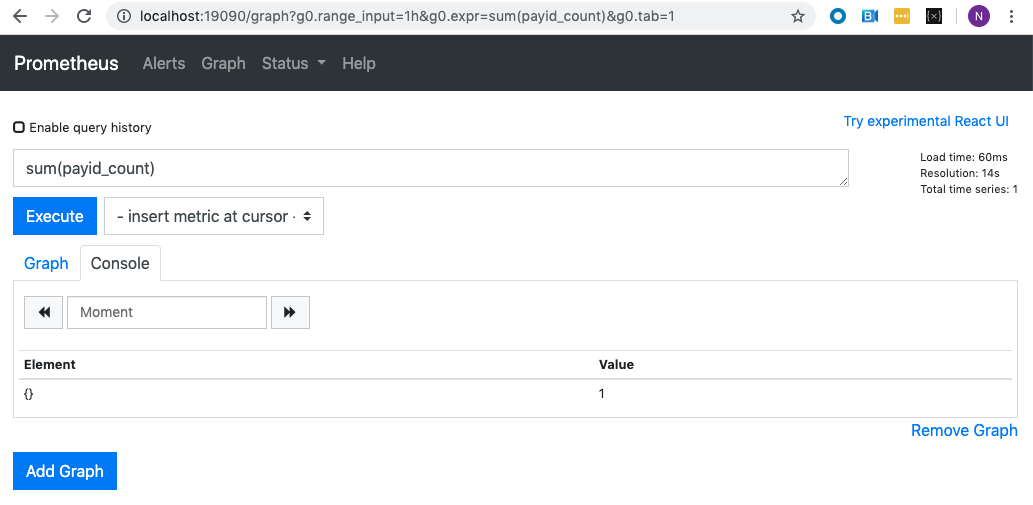
You can verify Prometheus is running by opening http://localhost:9090/graph in a browser.
You can verify metrics collection metrics are being collected by entering the following expression into the form:
sum(payid_count)
Click Execute. If successful, the results look like this:
Click the Graph tab to display the results in graph format.
Here are some other example expressions:
sum(payid_count) by (paymentNetwork)- Sum ofPayStringcount by payment network, such as XRPL, BTC, and so forth.sum(payid_lookup_request)- Total number ofPayStringlookup requests.rate(payid_lookup_request[5m])- Rate ofPayStringlookup requests per second.